Networking Insights
Analyze historical network traffic patterns, spot duplicate API calls, identify slow endpoints, and debug failures across sessions with Networking Insights.
While Network Traffic Monitoring shows you requests in real time, Networking Insights gives you a historical view. Open it from the Welcome view via Network Insights in the sidebar. You can analyze past requests, spot patterns, and export a filtered request set as a compact summary or a built-in AI prompt.
How it differs from Network Traffic Monitoring
Section titled “How it differs from Network Traffic Monitoring”Network Traffic Monitoring captures requests as they happen. Networking Insights stores and analyzes that data over time, making it easier to find recurring issues or compare request patterns across sessions.
What you can analyze
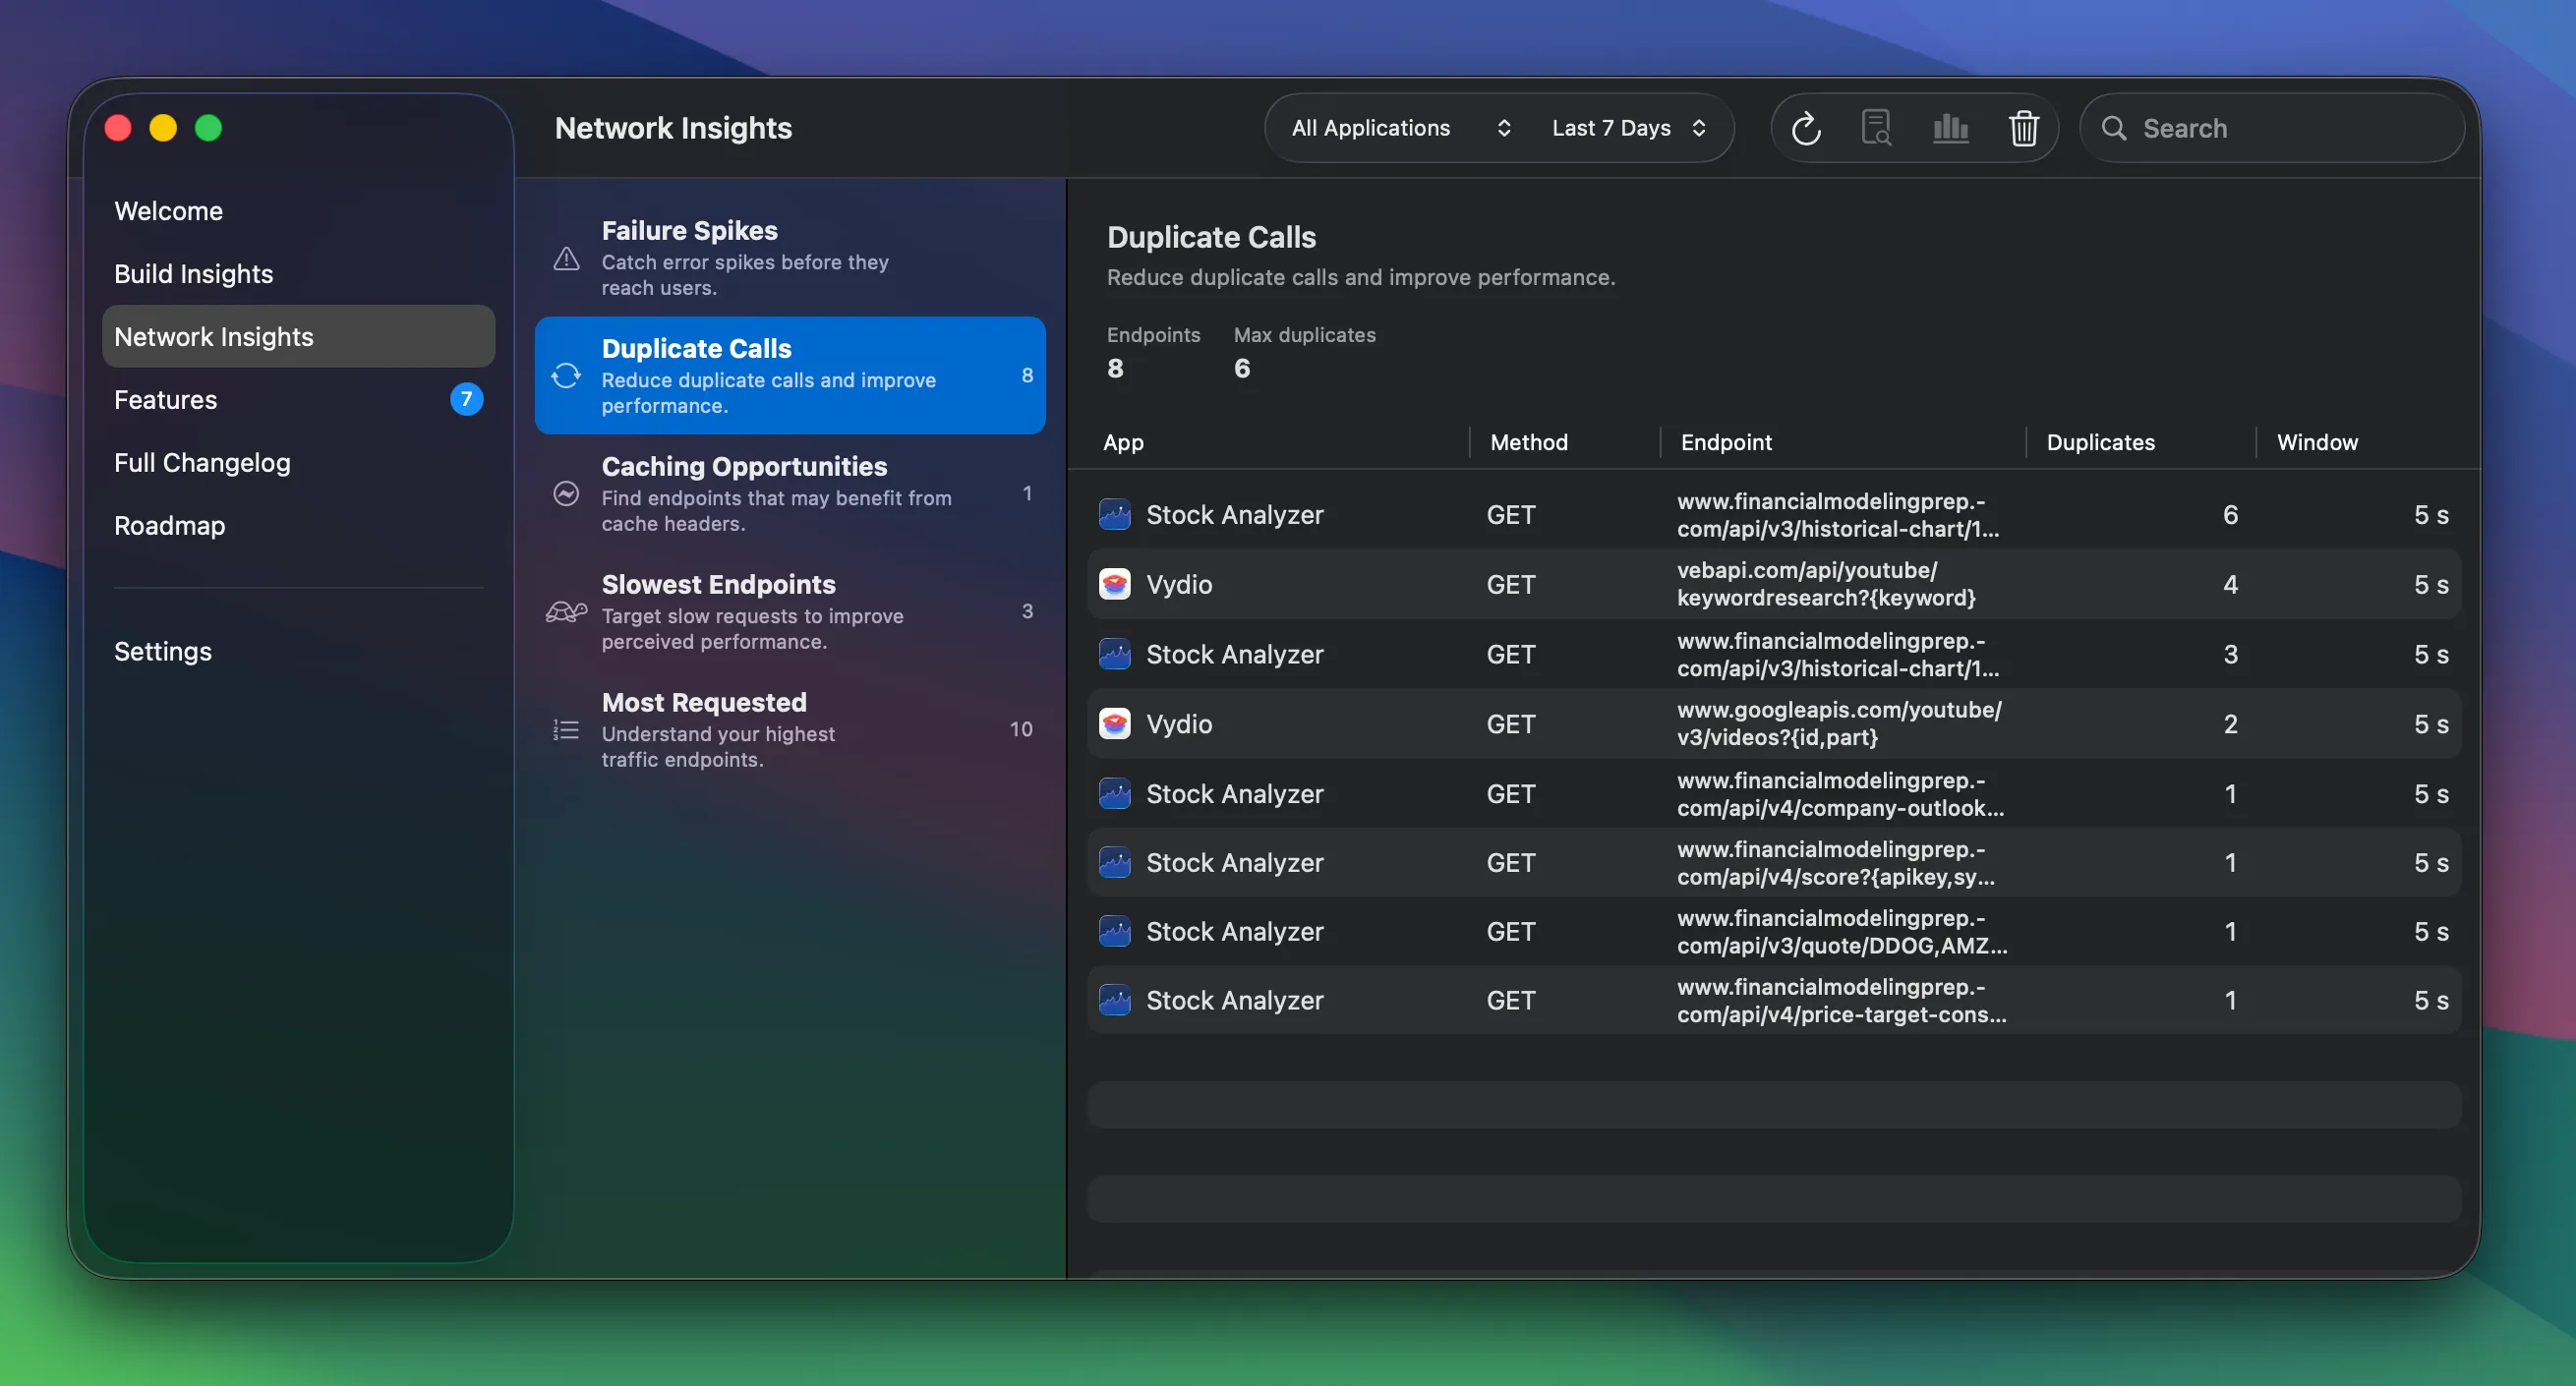
Section titled “What you can analyze”Use the toolbar to filter by app and time range (All Time, Last 7 Days, Last 30 Days, Last Hour). Insights are grouped into:
- Failure Spikes — Catch error spikes before they reach users.
- Duplicate Calls — Reduce duplicate calls and improve performance.
- Caching Opportunities — Find endpoints that may benefit from cache headers.
- Slowest Endpoints — Target slow requests to improve perceived performance.
- Most Requested — Understand your highest traffic endpoints.
Using request data with AI assistants
Section titled “Using request data with AI assistants”From the toolbar, RocketSim can generate:
- Copy export for a compact redacted export of the filtered request set
- Copy prompt for built-in prompt templates such as redundant calls and caching, performance and overfetching, or failures and error spikes
From the detail view, you can still copy the request, response, headers, or cURL for a single request when you want the full low-level data.
For the full workflow, see Exporting Network Requests as Prompts.
Networking Insights requires RocketSim Connect to be set up.