Debugging URLSession requests without a proxy sounds like a small workflow improvement until you hit a network bug right before shipping. You open the app, reproduce the issue, and realize you did not start your proxy, forgot to trust a certificate, or missed the exact request that failed.
Proxy tools like Charles Proxy and Proxyman are powerful, and I still think they have a place. However, most everyday iOS Simulator debugging is simpler: I want to see which URLSession requests fired, what the response looked like, why a call failed, and whether the app made the same request too many times. RocketSim’s Network Monitor focuses on that loop.
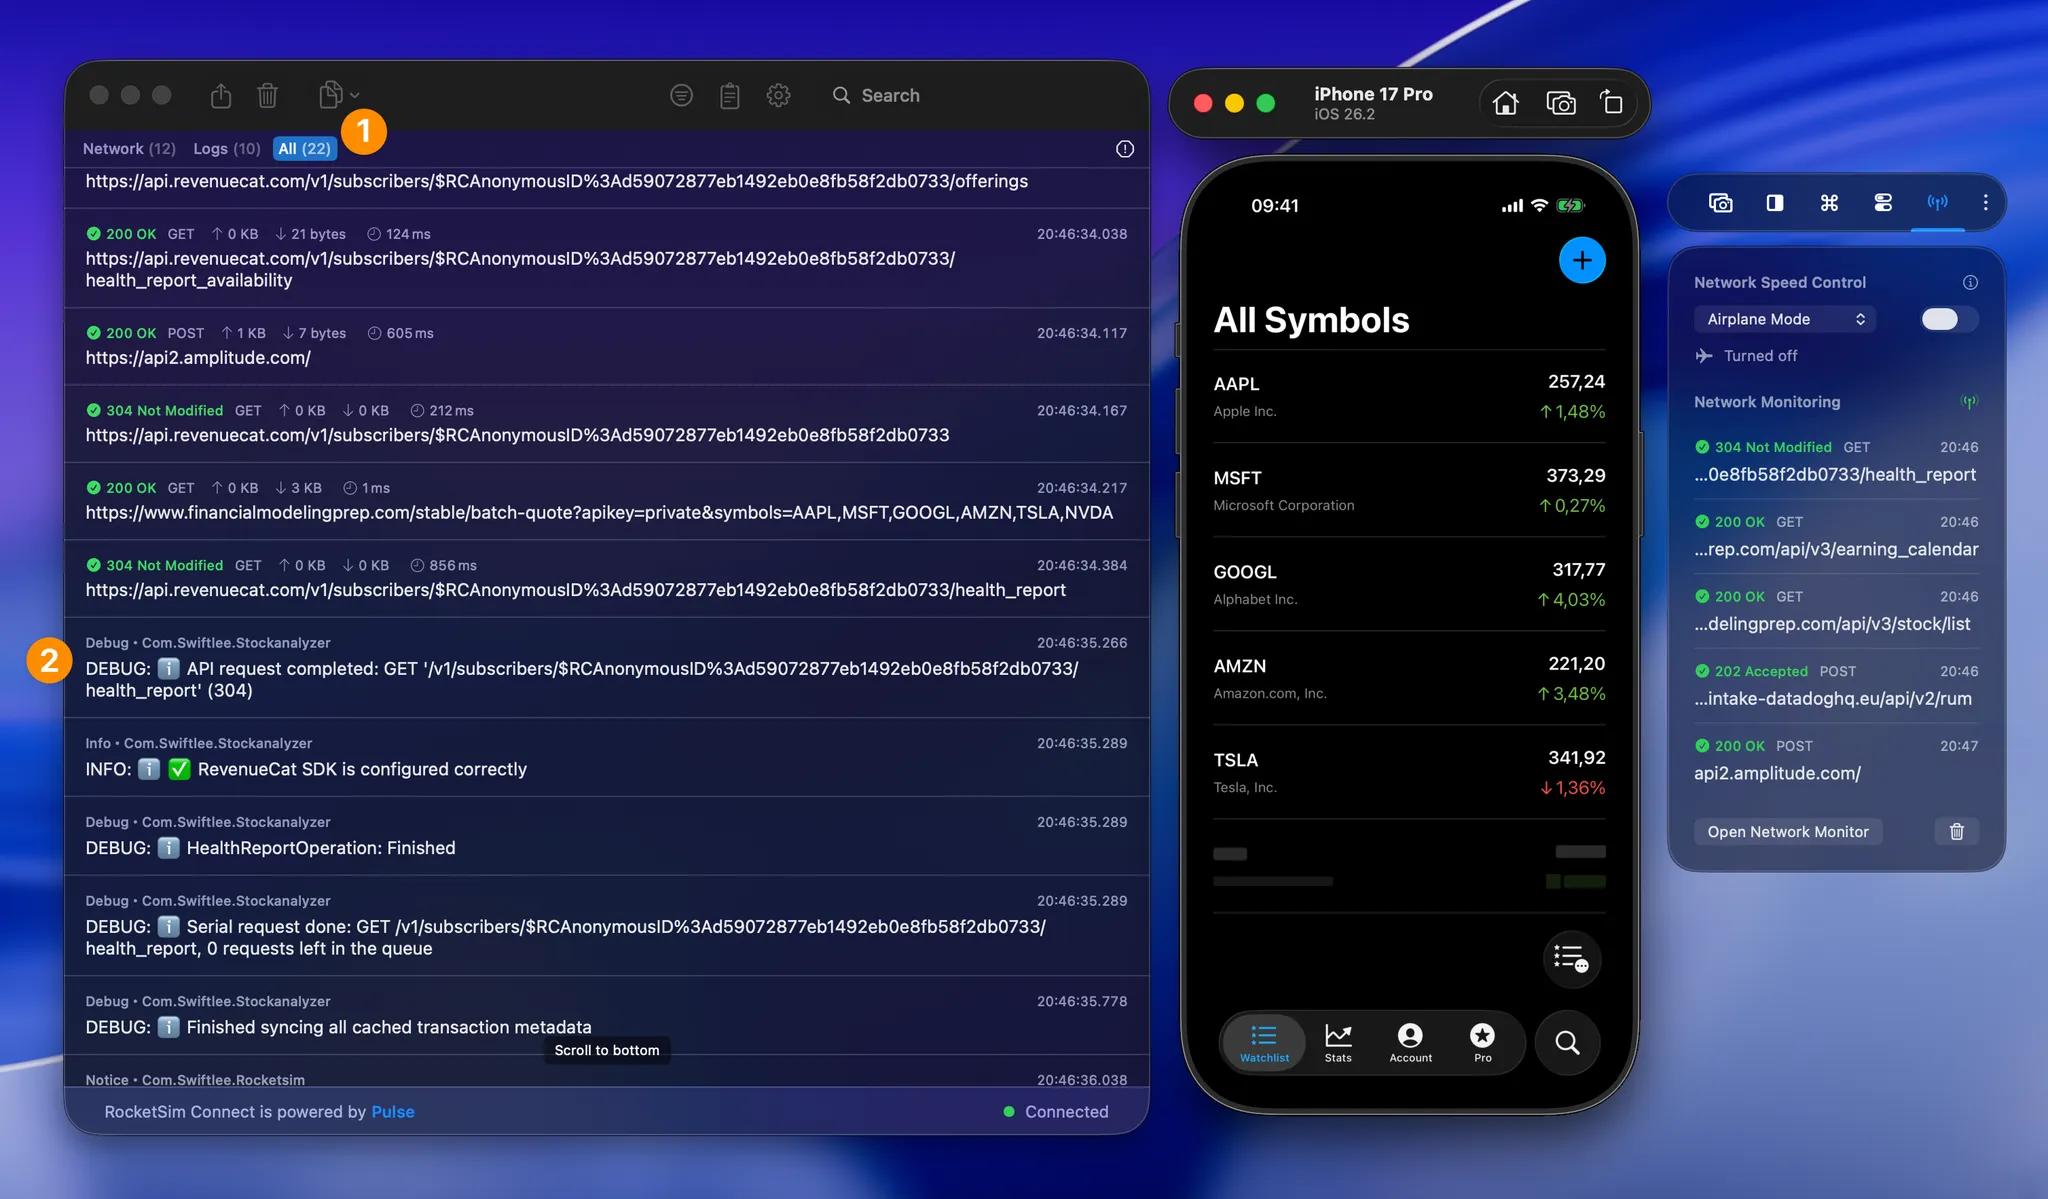
The banner above shows why I like this view during development. The first callout highlights the filters for Network, Logs, or All, while the second callout shows debug logs mixed into the same timeline as your requests. Seeing both together makes it much easier to understand what happened before and after a failing API call.
Why proxy setup slows you down
Proxy debugging often starts with setup instead of debugging. You configure a system proxy, install a certificate, trust it on the Simulator, enable SSL proxying for the right host, and then hope the app is using a networking stack that goes through the path you expect.
That is fine when you need full proxy power. You might want to rewrite responses, inspect traffic from an app you cannot instrument, or test low-level proxy behavior. In those cases, a dedicated proxy tool is the right choice.
However, if you are debugging your own app during normal development, the setup can be too much. The bug happens, you want the request details now, and you do not want to restart the whole flow just because your proxy was not ready.
Use RocketSim’s Network Monitor
RocketSim takes a different route. With RocketSim Connect, your debug build connects to RocketSim locally and sends captured URLSession activity over Bonjour. There is no system proxy setup and no custom certificate to trust.
RocketSim’s Network Monitor shows URLSession requests, responses, logs, metrics, and cURL exports next to your Simulator workflow.
Once connected, RocketSim shows recent requests directly in the side window and a full Network Monitor when you need more detail. You can inspect headers, request and response bodies, status codes, metrics, and logs in one place.
In my own workflow, that timeline is the part I care about most. A single failed response is useful, but seeing the order around it is often what explains the bug. Did the token refresh run first? Did the app call the endpoint twice? Did a warning log appear before the request failed?
Inspect responses and failures
A network bug rarely starts with “the backend is down.” More often, it is a missing header, an unexpected response body, a stale token, a validation error, or a request that fires at the wrong time.
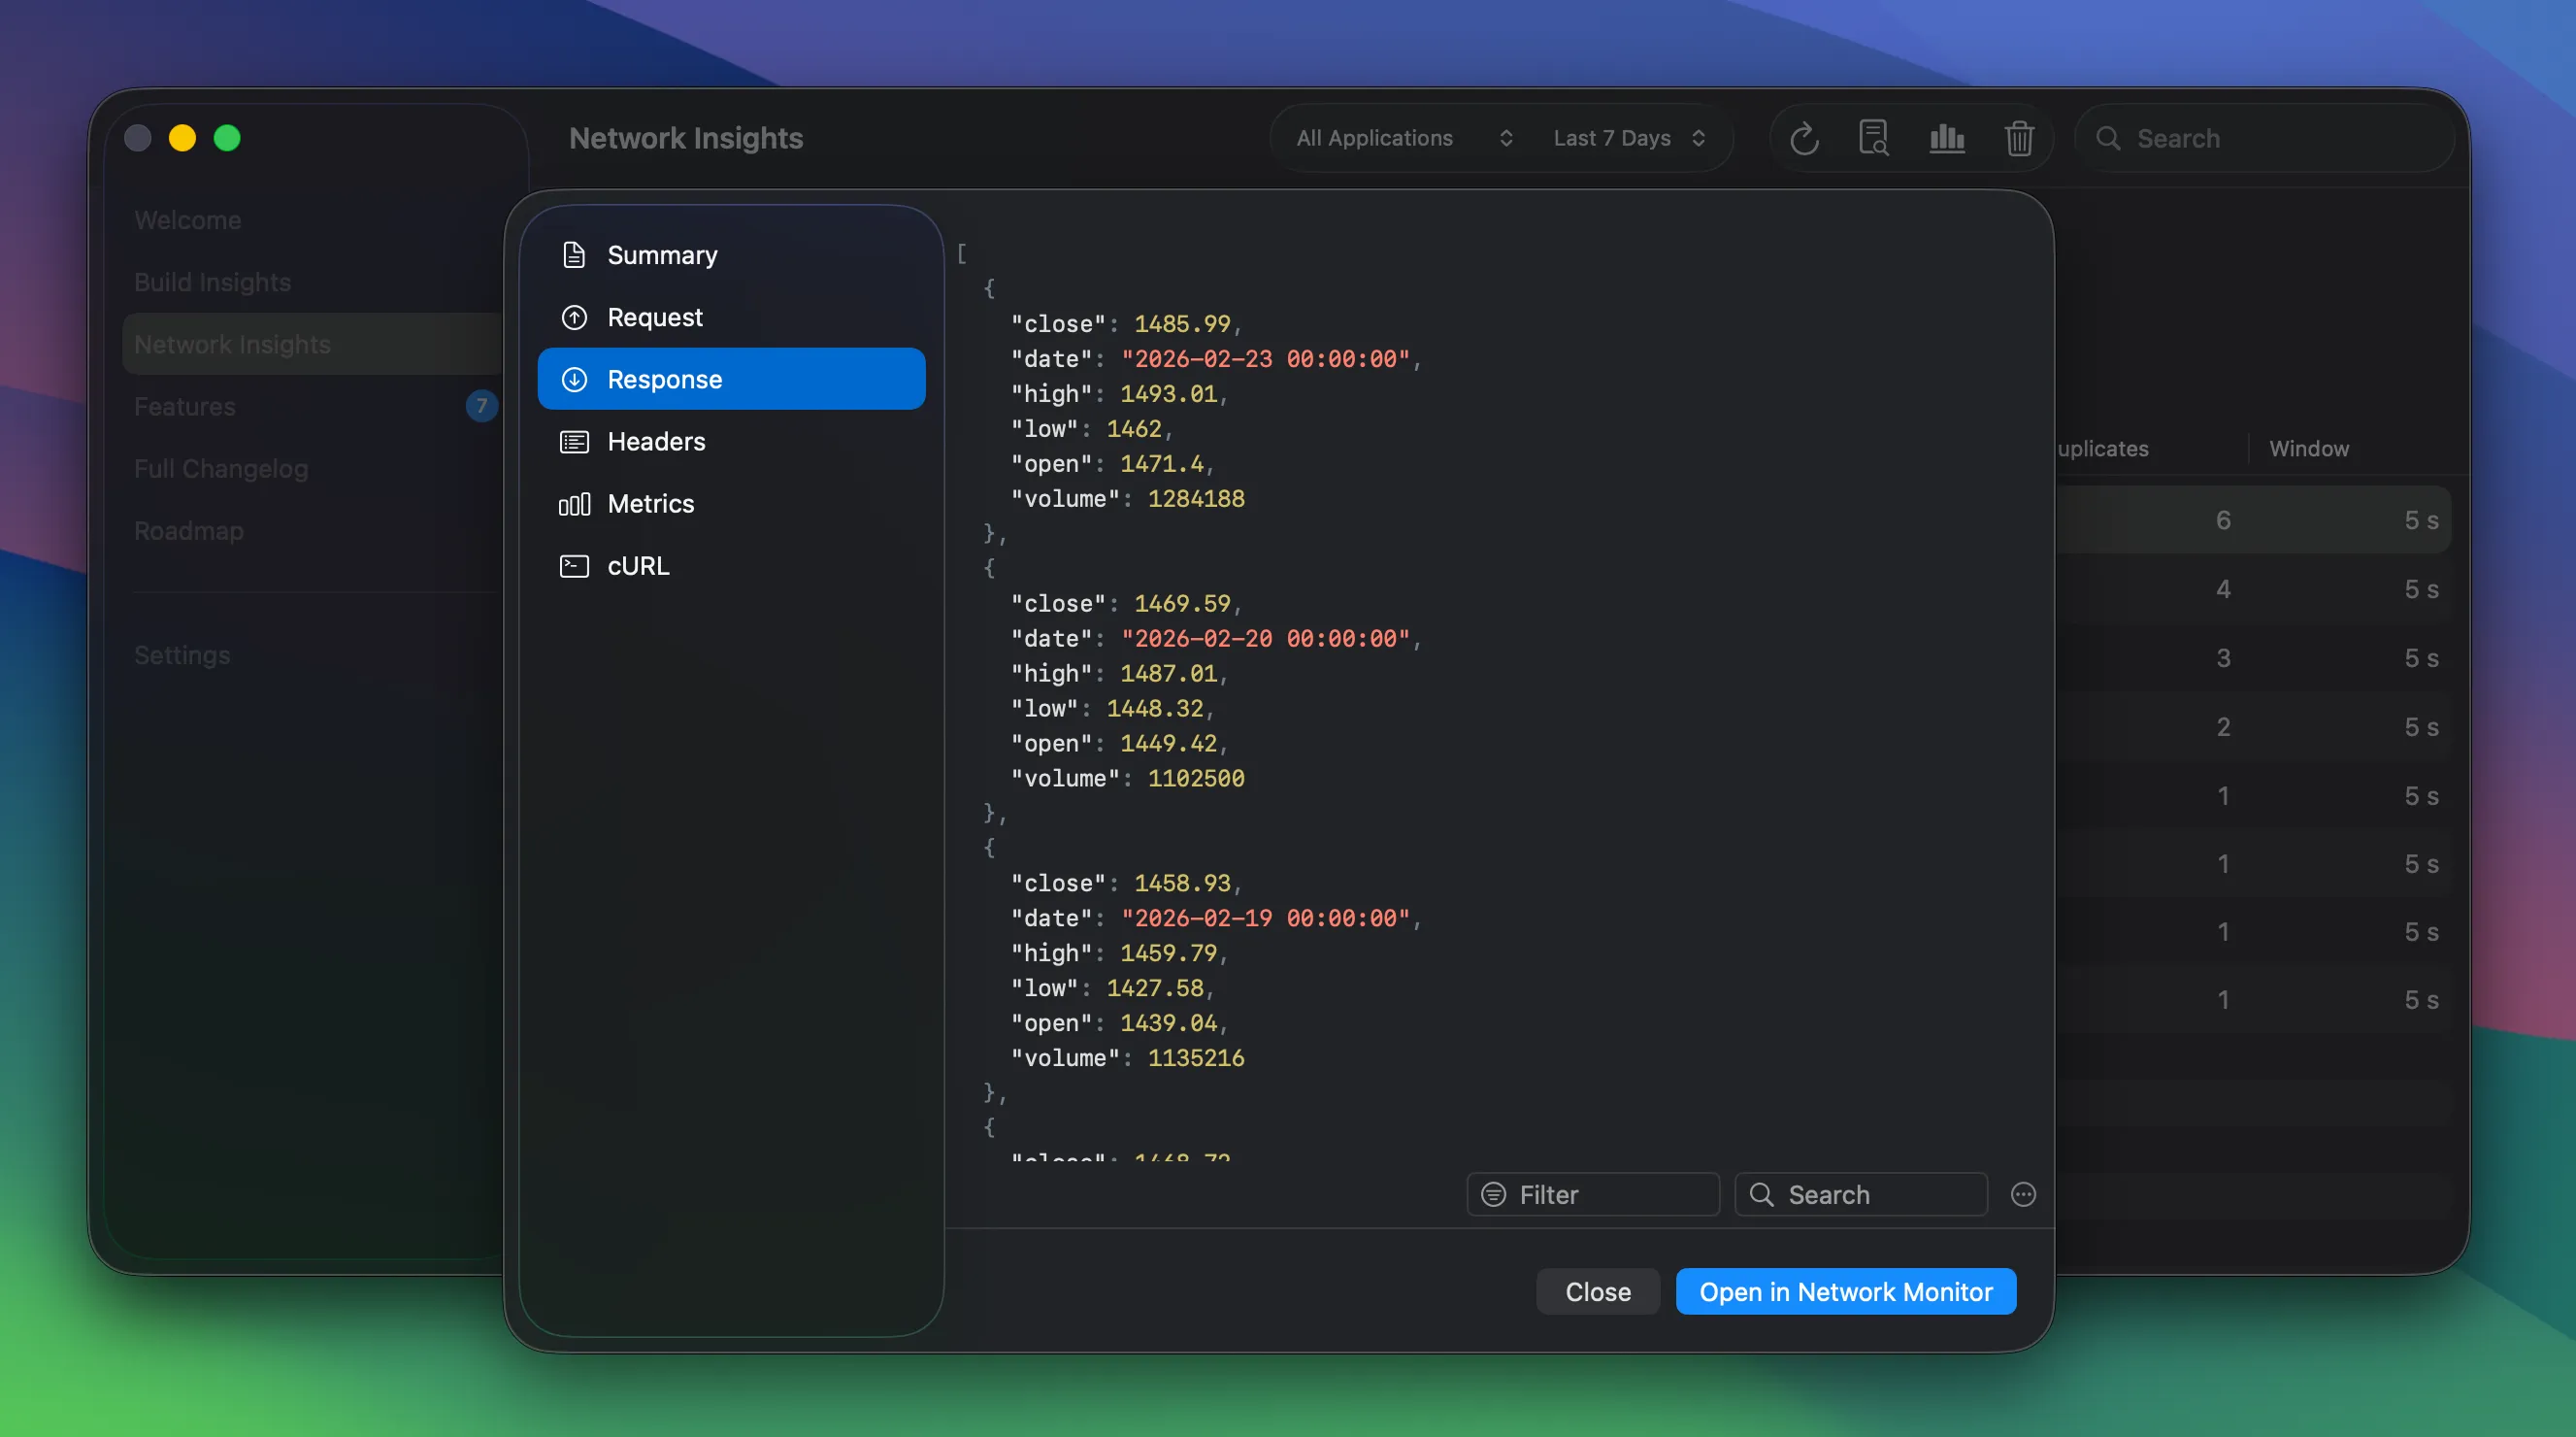
The request detail view gives you headers, response bodies, metrics, and a cURL export for the selected URLSession request.
RocketSim helps you answer those questions quickly:
- Which URLSession request failed?
- Which status code came back?
- What did the response body contain?
- Which app log appeared around the same time?
- Can I copy the request as cURL and reproduce it?
Copying a request as cURL is especially useful when you need to share a failing call with a teammate or backend engineer. It moves the conversation from “something is wrong” to “this exact request returns this exact response.”
If you only need a quick overview, the side window keeps recent traffic visible while you keep using the Simulator. If you need the full detail, the Network Monitor gives you the deeper request view.
Find duplicate calls
Network debugging is not only about failures. A lot of app performance issues come from repeated or wasteful requests: the same endpoint fires when a view reappears, a list reloads too often, or a detail screen fetches more data than it needs.
Networking Insights gives you a historical view of those patterns. You can look for duplicate calls, caching opportunities, slow endpoints, failure spikes, and the most requested URLs across sessions.
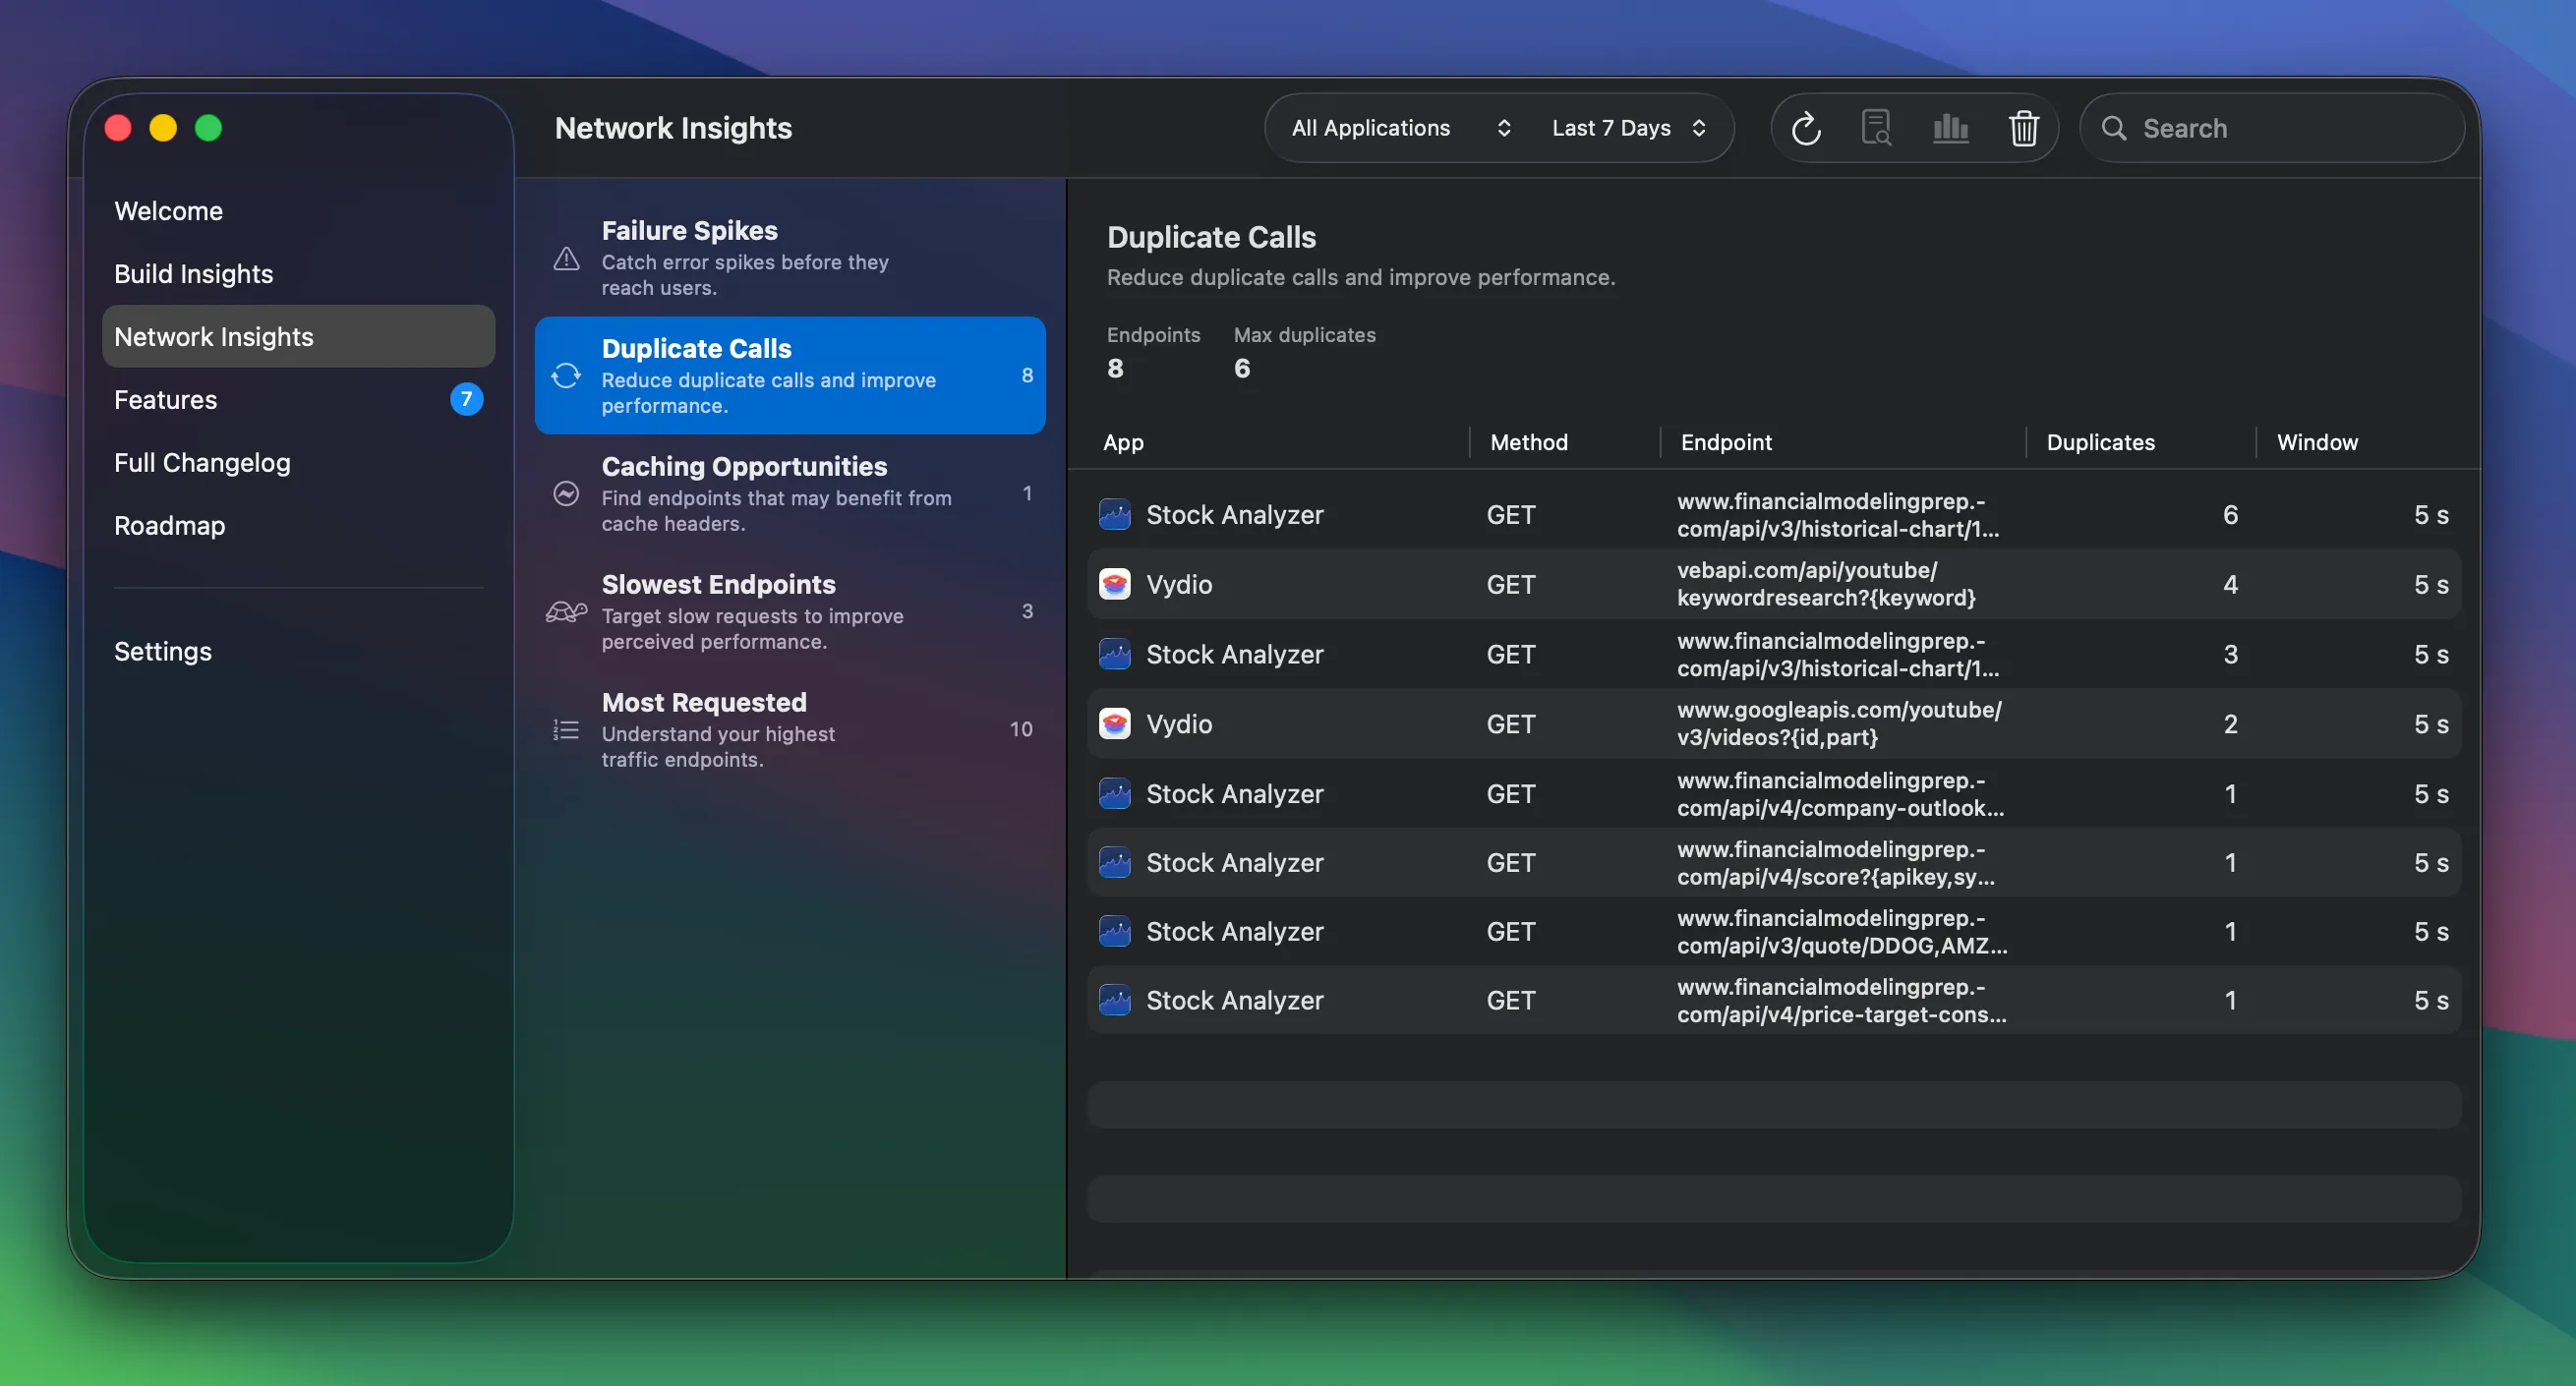
Networking Insights turns captured traffic into patterns you can act on, like duplicate calls, slow endpoints, and failure spikes.
This is the kind of debugging I like because it turns invisible waste into something concrete. You might feel that a screen is slow, but seeing five duplicate calls in a row makes the fix obvious.
Export requests to AI
RocketSim can also export network requests as redacted prompts for AI-assisted debugging. Instead of pasting raw request data into Claude or ChatGPT, you can use AI Network Request Prompts to generate focused summaries.
The built-in prompt types target common problems:
- Redundant calls & caching for duplicate requests and missing cache strategy
- Performance / overfetching for slow endpoints and oversized payloads
- Failures & error spikes for non-2xx responses and likely causes
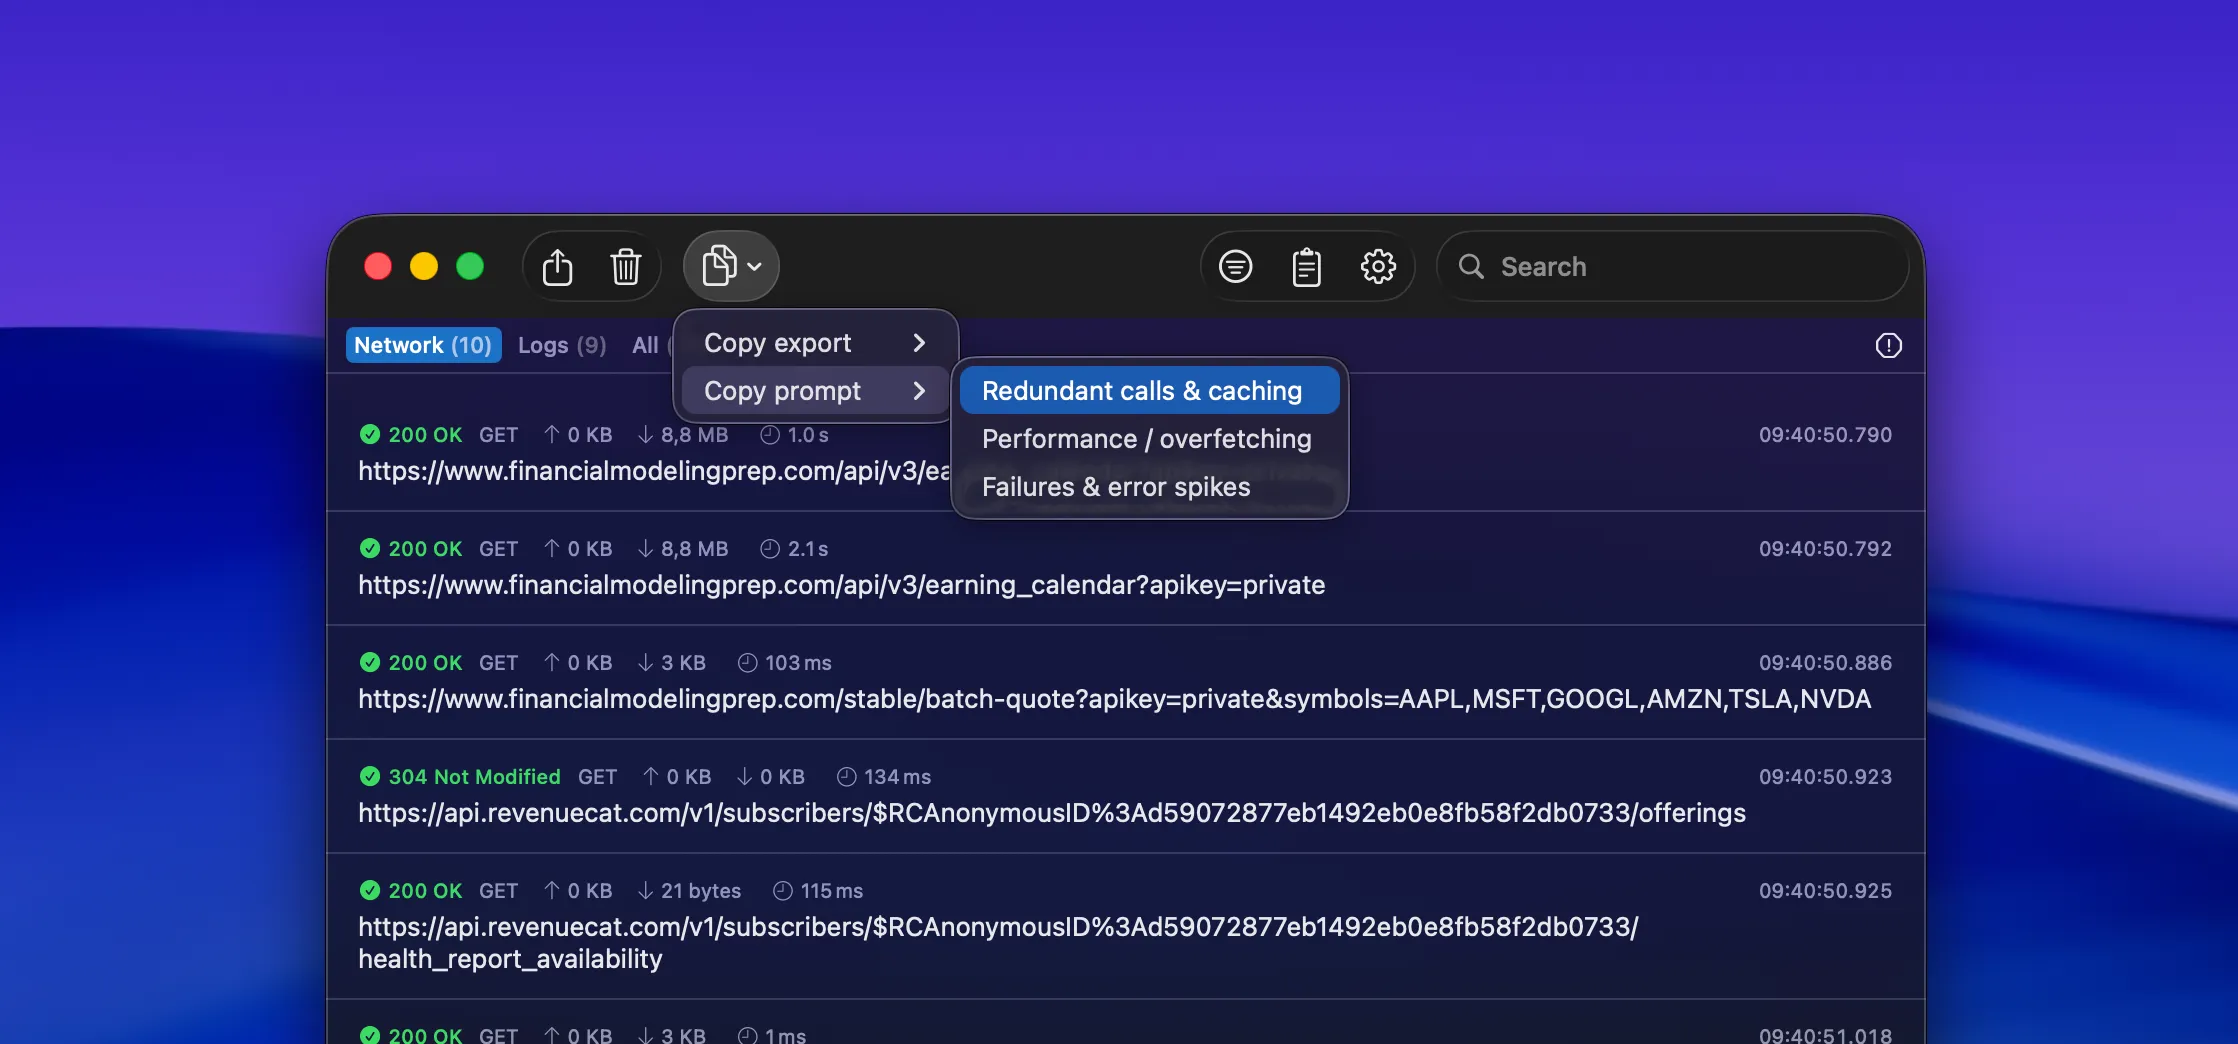
Copy export and Copy prompt turn a filtered request set into redacted, AI-ready debugging context.
The redaction is important. Network traffic often contains bearer tokens, user identifiers, or private payloads. RocketSim keeps the export compact and removes sensitive values so you can ask an AI assistant for help without dumping raw traffic into a chat.
Keep proxy tools for proxy-specific jobs
Proxy tools are still the right choice when you need proxy-specific power: response rewriting, breakpoints, advanced SSL inspection, or traffic from apps you cannot instrument. Tools like Charles Proxy and Proxyman are excellent for those jobs.
RocketSim is for the everyday debug-build loop. You are working on your own iOS app, running it in the Simulator, and you want request visibility without setup friction. That covers a lot of debugging sessions.
The nice part is that both workflows can exist together. Use RocketSim for the fast loop, then reach for a full proxy when the bug specifically needs proxy behavior.
Conclusion
Debugging URLSession requests without a proxy is mostly about removing friction. If your debug build can show requests, responses, failures, logs, cURL exports, historical insights, and AI-ready summaries right next to the Simulator, you can catch many issues before they turn into longer debugging sessions.
If you have a network issue to investigate in your own app, install RocketSim from the Mac App Store and follow the Network Monitor documentation. You can also read Apple’s URLSession documentation if you want to revisit the API RocketSim observes in debug builds. Feel free to reach out on X/Twitter or open an issue on GitHub if you have ideas for better network debugging workflows. Thanks!